An independent gaming handbookFor gamers on the go — since 2001

How long

How Long a Handheld Battery Actually Lasts, and What Drains It Fastest

The number on the box, and the number you actually get.
HardwarePocketGamer deskReviewed

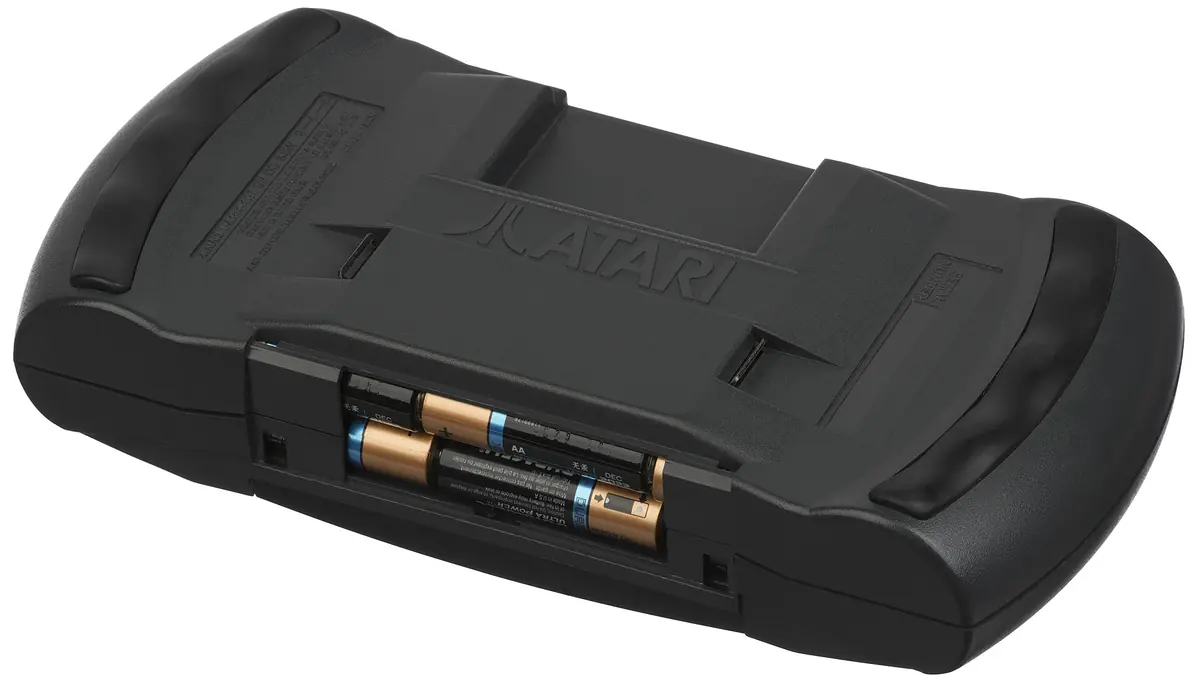
How Long a Handheld Battery Actually Lasts, and What Drains It Fastest - illustration

Photograph: Evan-Amos · Public domain pd · Wikimedia Commons

The takeawayCan predict runtime for the games they play and knows which two settings buy the most time.

How long a handheld actually stays powered depends entirely on the workload and display configuration rather than the headline number printed on the retail carton. Across modern portable systems, the gap between a light visual novel and an unconstrained 3D title swings operational endurance from roughly two hours to well over ten hours on the same hardware platform.

What the box claim actually means

Manufacturer specifications for portable gaming devices rarely describe a fixed duration. When Nintendo publishes technical data for the Switch OLED model, it specifies a window of approximately 4.5 to 9 hours. Crucially, Nintendo does not present this as a guaranteed baseline for all play sessions; the company explicitly states that the runtime estimate varies based on the specific software executed and operating conditions.

Valve adopts the same methodology for the Steam Deck OLED. Product documentation from Valve outlines an expected battery life ranging from 3 to 12 hours. Valve ties this variance directly to the content being played. A static puzzle game does not draw the same current from the internal cell as a high-fidelity rendering pipeline pushing the compute units to maximum thermal design power.

Treating a manufacturer range as an average is a structural mistake. The lower boundary represents heavy system load where compute silicon, storage read cycles, display backlights, and cooling fans run near physical limits. The upper boundary reflects passive scenarios, minimal compute footprints, or light 2D rendering at reduced display luminance.

A single runtime number cannot describe a device where the processor workload fluctuates between 5 watts and 25 watts. Retail packaging prioritises the widest possible window for marketing compliance, but functional endurance follows the actual watt-hour consumption per minute of active execution.

The settings that move runtime most

Two primary variables dictate the discharge curve of modern x86 and ARM handhelds: processor power draw and display output. The internal thermal design power (TDP) configured in software defines how much electrical energy the system-on-chip is allowed to consume.

In controlled hardware testing by Notebookcheck on the MSI Claw 8 AI+, adjusting the TDP ceiling produced dramatic shifts in total operational runtime while keeping baseline system parameters constant. When the device was configured with screen brightness set to 50 percent, display refresh rate pinned at 60 Hz, cooling fans set to auto, and Wi-Fi, Bluetooth, and RGB lighting left active, the endurance changed predictably across three tested power profiles:

  • At an 8 W TDP configuration, the system sustained 8 hours and 40 minutes of operation.
  • Raising the ceiling to a 17 W TDP configuration reduced runtime to 3 hours and 40 minutes.
  • At a 25 W TDP configuration, total endurance fell to 2 hours and 20 minutes.

Moving the silicon budget from 8 watts to 25 watts shaved more than six hours of operating time from the device. This test isolated processor draw while maintaining standard wireless radios and lighting states.

Display behavior introduces another layer of variance. In battery comparison testing conducted by XDA on the ROG Ally X, the hardware firmware automatically reduced screen brightness when the remaining charge hit 20 percent. This built-in power preservation profile alters the discharge slope during the final fifth of the pack capacity, artificially stretching the remaining minutes unless manually overridden by the user.

Display refresh rates also alter power draw, as driving a panel at higher cycle rates requires continuous frame delivery from the graphics pipeline and elevated display controller throughput.

Radio peripherals and secondary hardware elements consume measurable baseline energy. Leaving wireless communications active forces the onboard network controller to maintain polling cycles and signal handshakes with local access points. When Wired documented its standard Nintendo battery testing protocol in 2012, its lab methodology isolated maximum hardware drain by setting screen brightness to maximum while explicitly disabling all wireless communications and stereoscopic 3D processing. That approach eliminated network polling fluctuations from the final runtime tally.

Why light games last much longer

The compute gap between rendering simple two-dimensional sprites and processing geometry-dense three-dimensional worlds explains why identical hardware produces radically divergent battery figures.

A 2026 comparison review published by Tech-Insider documented that a modern handheld achieved nearly 19 hours and 40 minutes under minimal operational load, low screen brightness, and a 60 Hz frame cap. When subjected to high rendering load at maximum screen brightness, the exact same hardware platform saw its operational endurance collapse to 2 hours.

Valve’s published baseline expectations and third-party comparison testing cited by Tech-Insider in 2026 mirror this spread on the Steam Deck OLED. Lighter 2D titles or lower-overhead independent releases reliably hit approximately 12 hours of continuous operation. Punishing, top-tier AAA releases compress that window down to roughly 3 hours.

Physical battery capacity sets the total energy reservoir, but it does not prevent rapid depletion under heavy computational load. ASUS equips the ROG Ally X with an 80Wh battery pack. In technical specifications, ASUS notes that this 80Wh capacity allows the system to achieve up to 24 hours of local video playback.

Local video playback represents a specialized hardware decode task where specialized silicon decodes video frames efficiently while general-purpose compute cores remain in idle states. The moment that 80Wh battery must feed active 3D game rendering, memory bus saturation, active cooling fans, and high-frequency processor bursts, the discharge rate accelerates by several multiples. A massive battery capacity cushions total drain, but intense game engines exhaust even an 80Wh reserve in a fraction of the time required for passive media playback.

How reviewers actually measure battery life

Independent test labs construct standardized baselines to make runtime figures comparable, because uncalibrated battery testing produces chaotic figures. Without locked variables, a background system task or an ambient brightness change renders test runs invalid.

Review outlets stabilize testing across four primary hardware parameters:

  1. Display brightness: Testers lock the panel to a fixed nit value or a set percentage, such as the 50 percent brightness baseline used by Notebookcheck in its MSI Claw 8 AI+ driver evaluations, or the 100 percent maximum luminance used by Wired in its 2012 Nintendo tests.
  2. Refresh rate and frame limits: Panels are locked to fixed intervals, typically 60 Hz, preventing dynamic refresh adjustments from altering power draw mid-run.
  3. Peripheral and radio state: Background variables like Wi-Fi adapters, Bluetooth radios, and decorative RGB controllers are either standardized as active—as Notebookcheck did—or completely disabled, following the historical Wired testing methodology.
  4. Thermal profile and fan curves: Handheld thermal profiles are fixed to discrete wattage limits (such as 8 W, 17 W, or 25 W) rather than allowing dynamic software governors to fluctuate clock speeds during gameplay loops.

Understanding these testing parameters shows why real-world travel usage rarely matches published benchmark tables. A player using maximum panel brightness on a train with Wi-Fi searching for networks will drain a pack significantly faster than a benchmark executed at 50 percent brightness in airplane mode.

What to trust when planning a long trip

Calculating reliable uptime for travel requires discarding manufacturer video-playback claims and top-end marketing estimates.

When planning transit entertainment, the 24-hour local video playback specification on the ASUS ROG Ally X serves only as an upper boundary for passive multimedia consumption. It offers zero predictive value for playing an unconstrained modern action title. If you plan to run graphically demanding software on an 80Wh handheld, expected operational life will land much closer to the 2-to-3-hour floor observed in heavy-load testing.

To maximize runtime during long journeys without access to external charging:

  1. Cap the internal TDP floor: As proven by Notebookcheck's evaluation of the MSI Claw 8 AI+, reducing system draw from 25 W down to 8 W or 17 W more than doubles functional uptime, moving operational life from 2 hours and 20 minutes to 8 hours and 40 minutes.
  2. Adjust display settings before departure: Lowering panel luminance and locking refresh rates to 60 Hz minimizes the secondary power draw that accelerates depletion, while preventing unexpected drop-offs when hardware reaches low-battery states like the 20 percent threshold documented by XDA.
  3. Select appropriate software for the travel leg: Relying on the 3-hour minimum floor for complex AAA titles or the 12-hour ceiling for lightweight 2D games, as documented in Valve's Steam Deck OLED performance parameters, allows accurate journey planning.

Matching the workload to the battery capacity prevents mid-transit shutdowns. Handheld runtime is never a static figure built into the hardware; it is a dynamic mathematical product of processor load, display power, and rendering complexity.